Centreville, Virginia Market Report
Market Stats | Demographics | Neighborhood Info – Centreville, VA
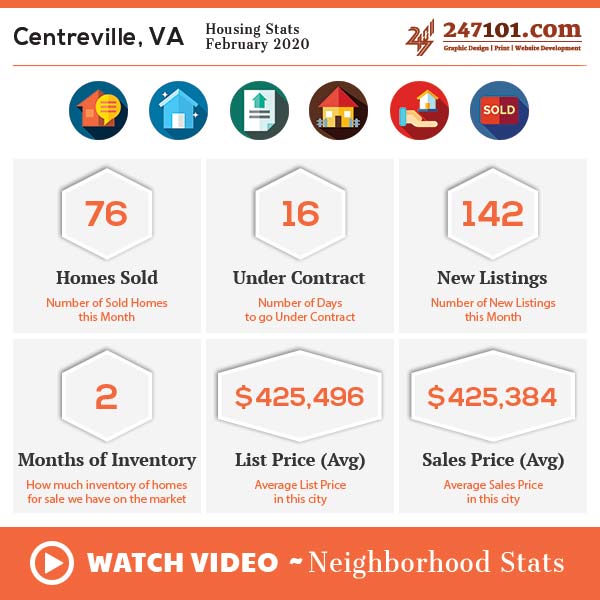
Housing Stats – Centreville, VA [February 2020]

| Market Data | Data |
|---|---|
| Number of Homes Sold | 76 |
| Number of days to go under Contract | 16 |
| New Listings | 142 |
| Months of Inventory | 2 |
| Average List Price | $425,496 |
| Average Sales Price | $425,384 |
| Own vs Rent | 70% – 30% |
| Population | 75.5K |
| Median Age | 37 |
| Male / Female Ratio | 50% |
| College Education | Centreville: 57.4% USA: 31.5% |
| Presidential Voting Pattern | Democrat 59.6% Republican 39.1% |
| Median Household Income | $112,174 |
| Top 2 Occupational Categories | Professional Health Care |
| Average Commute Time | Less than 30 Minutes: 46% More than 30 Minutes: 54% |


