Chantilly, Virginia Market Report
Market Stats | Demographics | Neighborhood Info – Chantilly, VA
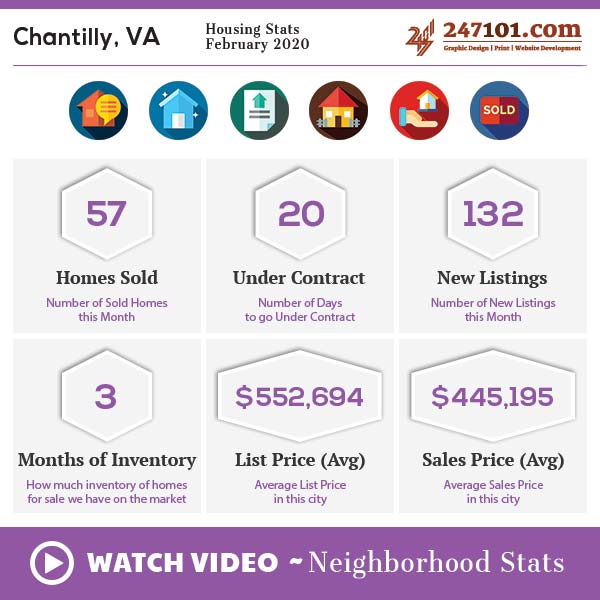
Housing Stats – Chantilly, VA [February 2020]

| Market Data | Data |
|---|---|
| Number of Homes Sold | 57 |
| Number of days to go under Contract | 20 |
| New Listings | 132 |
| Months of Inventory | 3 |
| Average List Price | $552,694 |
| Average Sales Price | $445,195 |
| Own vs Rent | 81% – 19% |
| Population | 24.6K |
| Median Age | 38 |
| Male / Female Ratio | 49% |
| College Education | Chantilly: 55.9% USA: 31.5% |
| Presidential Voting Pattern | Democrat 59.6% Republican 39.1% |
| Median Household Income | $123,424 |
| Top 2 Occupational Categories | Professional 3250 Health Care 1271 |
| Average Commute Time | Less than 30 Minutes: 52% More than 30 Minutes: 48% |


